Now that we are many months into the COVID-19 pandemic, I've started going back and reexamining the data for lessons or trends (you might say hindsight is 20/20). This time, I want to explore how COVID-19 has been spreading around the US. I do this by using a graphical idea I borrowed from Troy Hughes. where he charts all the state's curves in one chart but highlights the states experiencing the most growth.
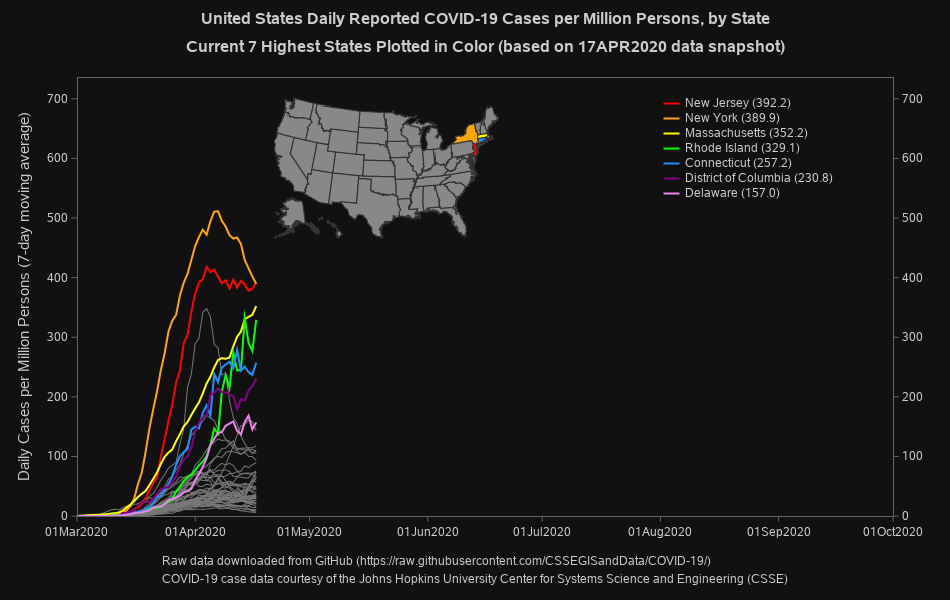
In this graphic, I first convert the COVID-19 data into new daily cases per 100,000 persons in each state (so that I can more fairly compare data between the states). Next, I calculate the seven-day moving average (to combat the effects of reduced testing during the weekends). Each line in the graph represents a different state, and the seven states with the highest COVID-19 rate on the most recent date are shown in a brighter color (rather than gray). The line graph has a color legend showing the top seven states, and I also add a geographical map showing the 7 top states (using the same colors).
One way of interpreting the spread of COVID-19 across the US is to look at it in waves. I'm borrowing Hughes' graphing method to show the three waves we have experienced so far.
Wave 1
The first COVID-19 wave in the US probably started in New York City and spread to the neighboring states in the northeast US. Most of the states in the northeast are fairly small in the map, therefore you might need to view it in full-size to see them more clearly.
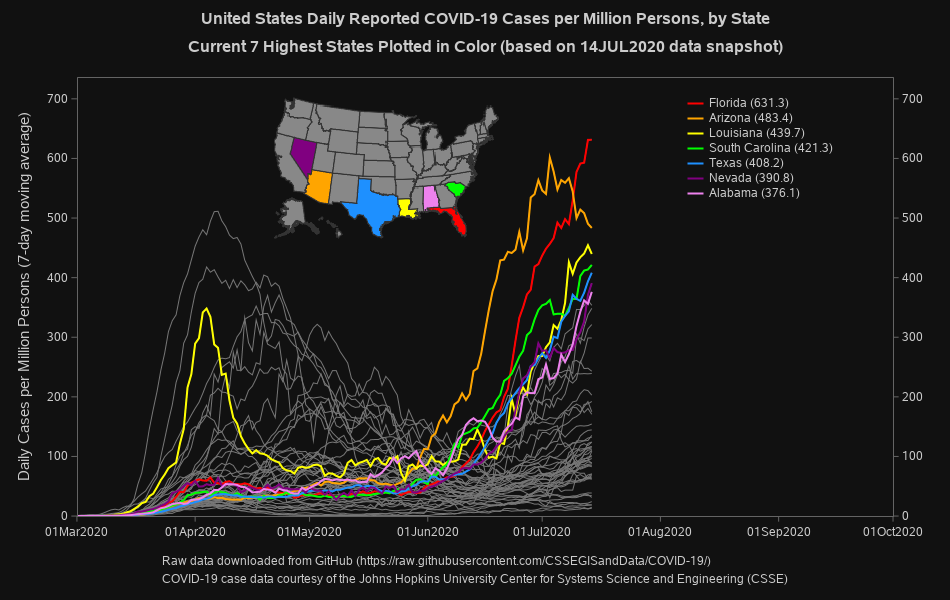
Wave 2
The second wave was about two or three months later and was generally comprised of states in the southern US. You might notice that Louisiana (yellow line) was also had a temporary/narrow spike in the first wave. I think that was probably due to the Mardi Gras celebration, but we don't have data to prove that here.
Wave 3
The third wave seems to be affecting mostly states in the central US.
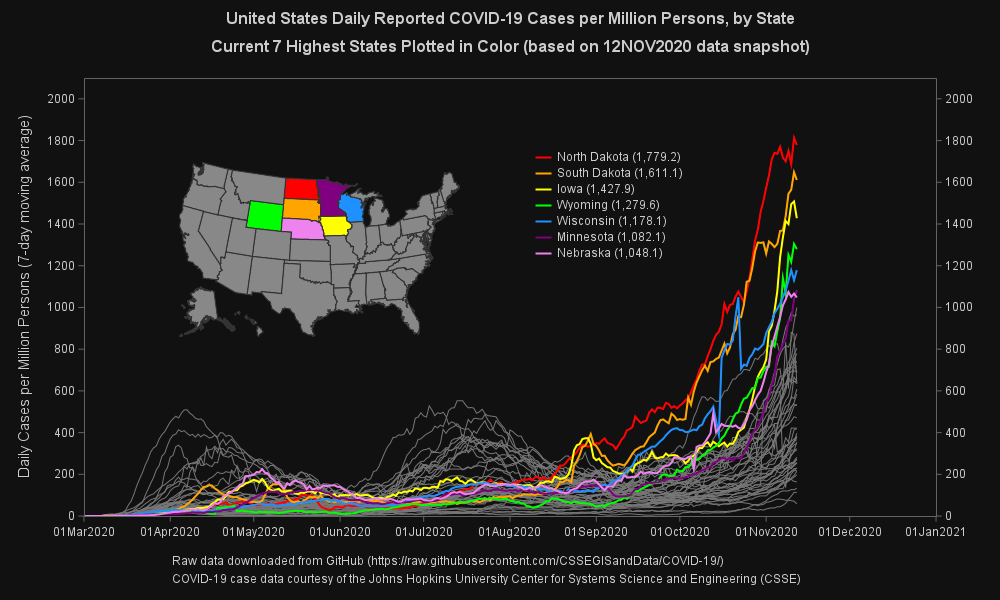
Dec 21 Update: Updated the wave-3 graph, as it had become more developed.
How'd he do that?!?
For those of you curious how I created these graphs, here's a general description, along with this link to the full SAS code. Who knows - you might download my code, and modify/improve it to make your own version of this graph!
- I used Proc Import to read in Johns Hopkins' csv data file, and then used Proc Transpose to change the structure and make the data more manageable (their csv file has each date in a separate column, whereas I wanted the dates to be values).
- Next, I calculate the amount of daily new cases using the lag() function in a data step (the csv file contains the cumulative total for each day).
- I use Proc Expand to calculate the seven-day moving average for each state.
- I draw the graph with Proc SGplot, using one series statement to draw all the lines in gray, and then a second series statement to overlay just the seven colored lines. I then use the keylegend statement to draw just the legend for the colored lines.
- And to finish the visual, I use Proc SGmap to create a choropleth map showing the top 7 states in color, and the rest in gray. I then annotate that map onto the line plot. I use styleattrs to assign the map colors (note that styleattrs is a new feature in the recently-released SAS 9.4m7).
Feel free to leave a comment with your interpretation of these graphs and maps. Why and how did the virus spread in these three separate waves? Or do you interpret these waves differently? Did you find these graphs useful? What are some other ways to graphically analyze the COVID-19 data, that might produce additional insight?
Happier waves
Talking about waves of the pandemic can be a bit grim, so I thought I'd finish this blog post talking about a different kind of wave: water waves! As I often do, I canvassed my Facebook friends asking for a picture of them having fun on a wave. My friend Jack (who runs a surfing school on the North Carolina coast) let me use this picture of his son hot-dogging on some waves:
And the final picture is my friend (and co-worker) Mike - we worked in the same group when I first started at SAS, 25+ years ago. And he is surfing on ... a lake!?! Yep - a lake! Mike's got a boat that's specially designed to create waves behind the boat that you can actually surf on (no rope, no pulling ... wakesurfing!)


1 Comment
Pingback: Coronavirus: per million, per 100k, or percent? - Graphically Speaking